Learn from our Infographics

Our infographics are one of the cornerstones of what makes KnowledgeisWatt unique.
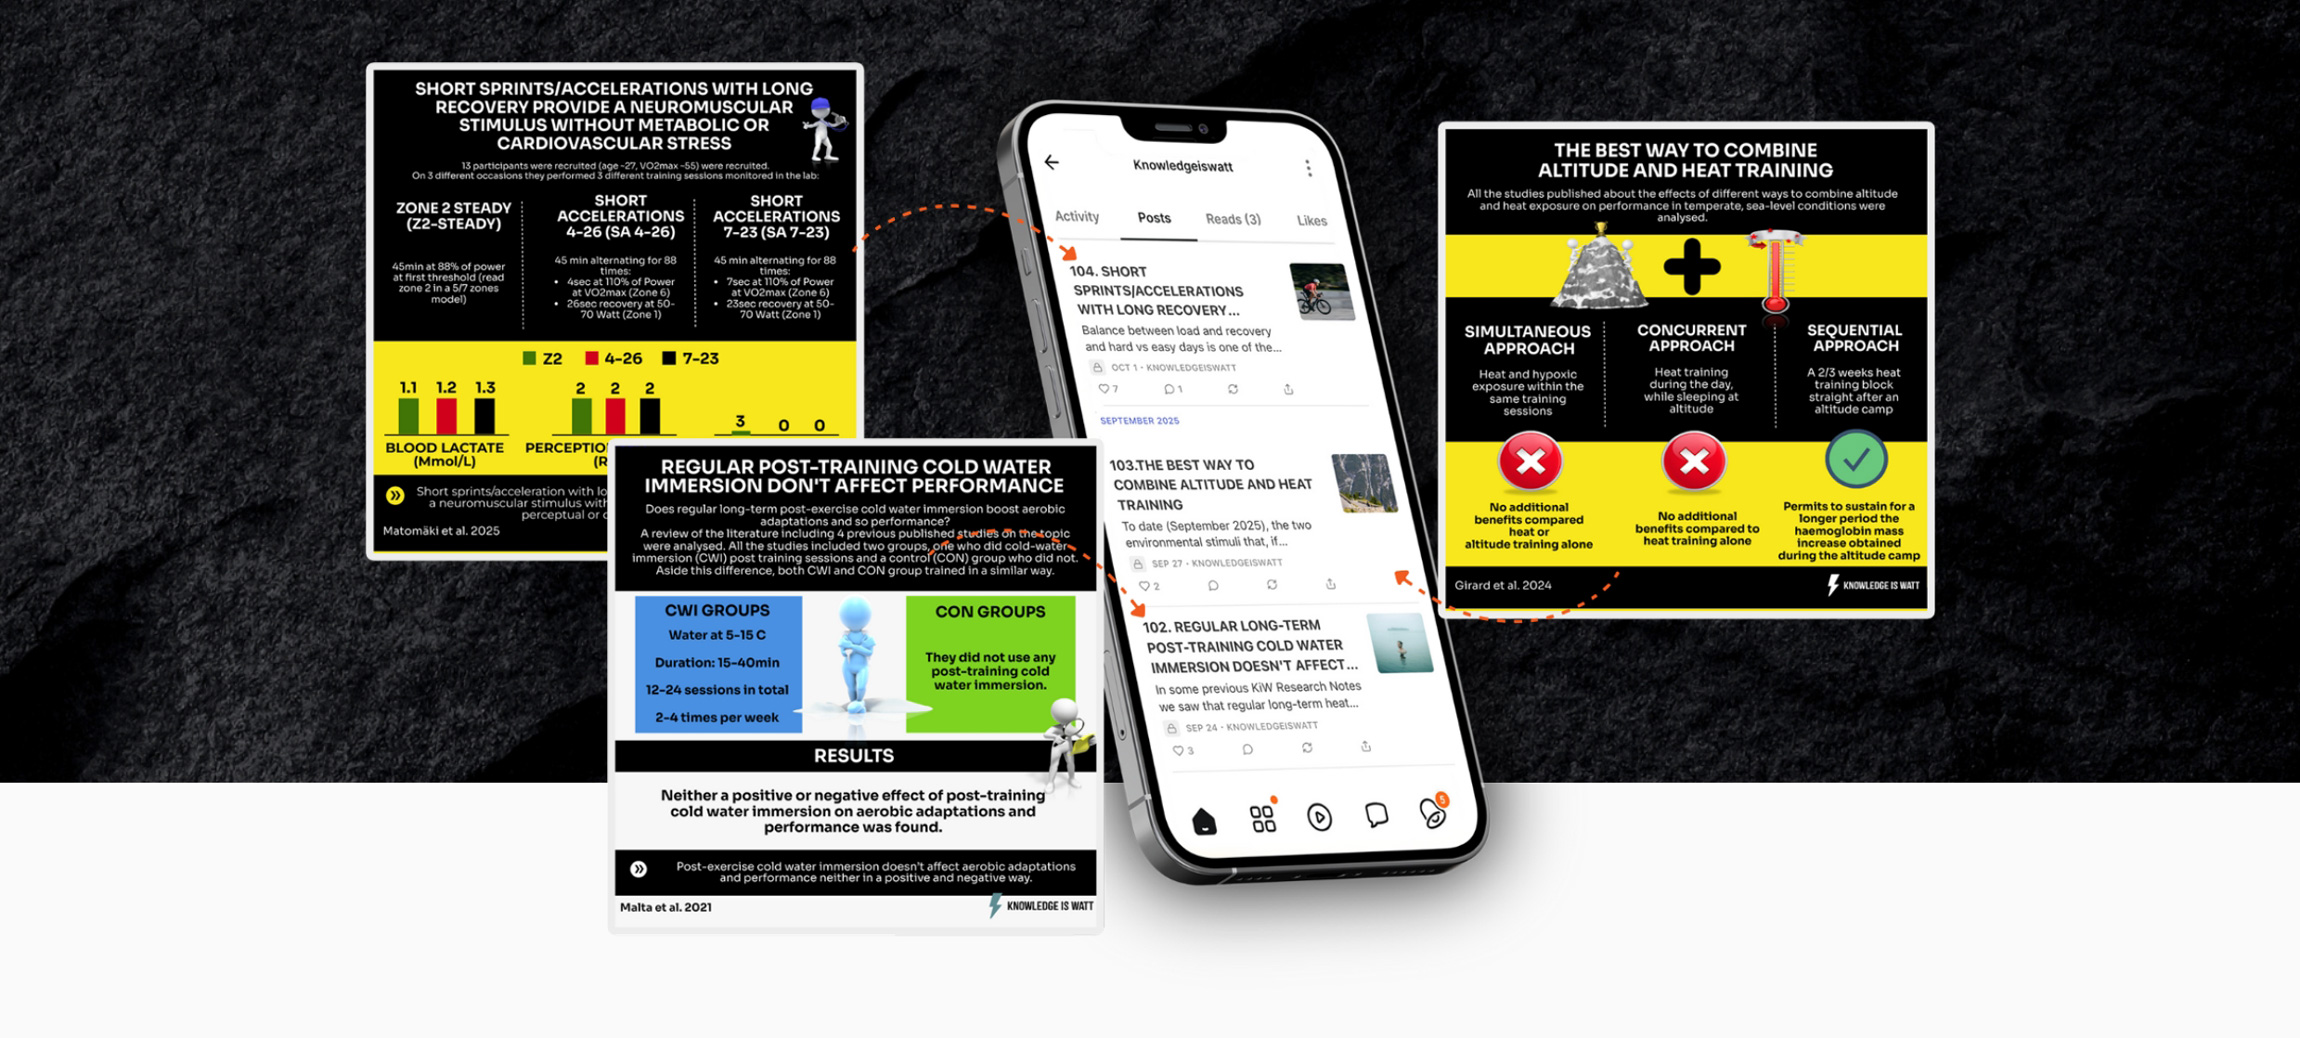
They distill complex cycling performance science studies into clear, concise summaries, making it easy for readers to discover scientific data and learn quickly.


For those seeking a deeper understanding, most of our infographics are accompanied by a related KIW Research Note, that is a review and comment of the relative study, which offers more detailed insights
.

So, infographics are for discovering, KIW Research Notes are for a deeper learning and understanding of the data and the topic.

JOIN KIW RESEARCH NOTES

Subscribe to KIW Substack today to receive our weekly cycling performance research reviews and get access to all the previously published articles (100+!)

HIGH-VOLUME MEANS DIFFERENT HOURS DEPENDING ON THE ENDURANCE SPORT CONSIDERED

LEARN MORE HIGH-VOLUME MEANS DIFFERENT HOURS DEPENDING ON THE ENDURANCE SPORT CONSIDERED 0

TIME SPENT IN INTENSITY ZONES IN DIFFERENT ENDURANCE SPORTS BY NORWEGIAN WORLD-CLASS ATHLETES

LEARN MORE TIME SPENT IN INTENSITY ZONES IN DIFFERENT ENDURANCE SPORTS BY NORWEGIAN WORLD-CLASS ATHLETES 0

KEY TRAINING STRATEGIES BY SUCCESSFUL WORLD-CLASS ENDURANCE NORWEGIAN COACHES

LEARN MORE KEY TRAINING STRATEGIES BY SUCCESSFUL WORLD-CLASS ENDURANCE NORWEGIAN COACHES 0

PERIODIZATION OF TIME SPENT IN ZONES IN PROFESSIONAL MALE ROAD CYCLISTS

PERIODIZATION OF TIME SPENT IN ZONES IN PROFESSIONAL MALE ROAD CYCLISTS 0

INTENSITY DISTRIBUTION IN 3 TOP 5 GC GIRO D'ITALIA FINISHERS

INTENSITY DISTRIBUTION IN 3 TOP 5 GC GIRO D'ITALIA FINISHERS 0

TIME SPENT IN ZONES TRAINING VS RACING

TIME SPENT IN ZONES TRAINING VS RACING 0

Filter for Category